
Payload Range Functionality.#
Overview#
Aviary has the capability to generate payload range diagrams for models utilizing the ENERGY_STATE equations of motion. Support for the TWO_DEGREES_OF_FREEDOM equations of motion is planned in a future release.
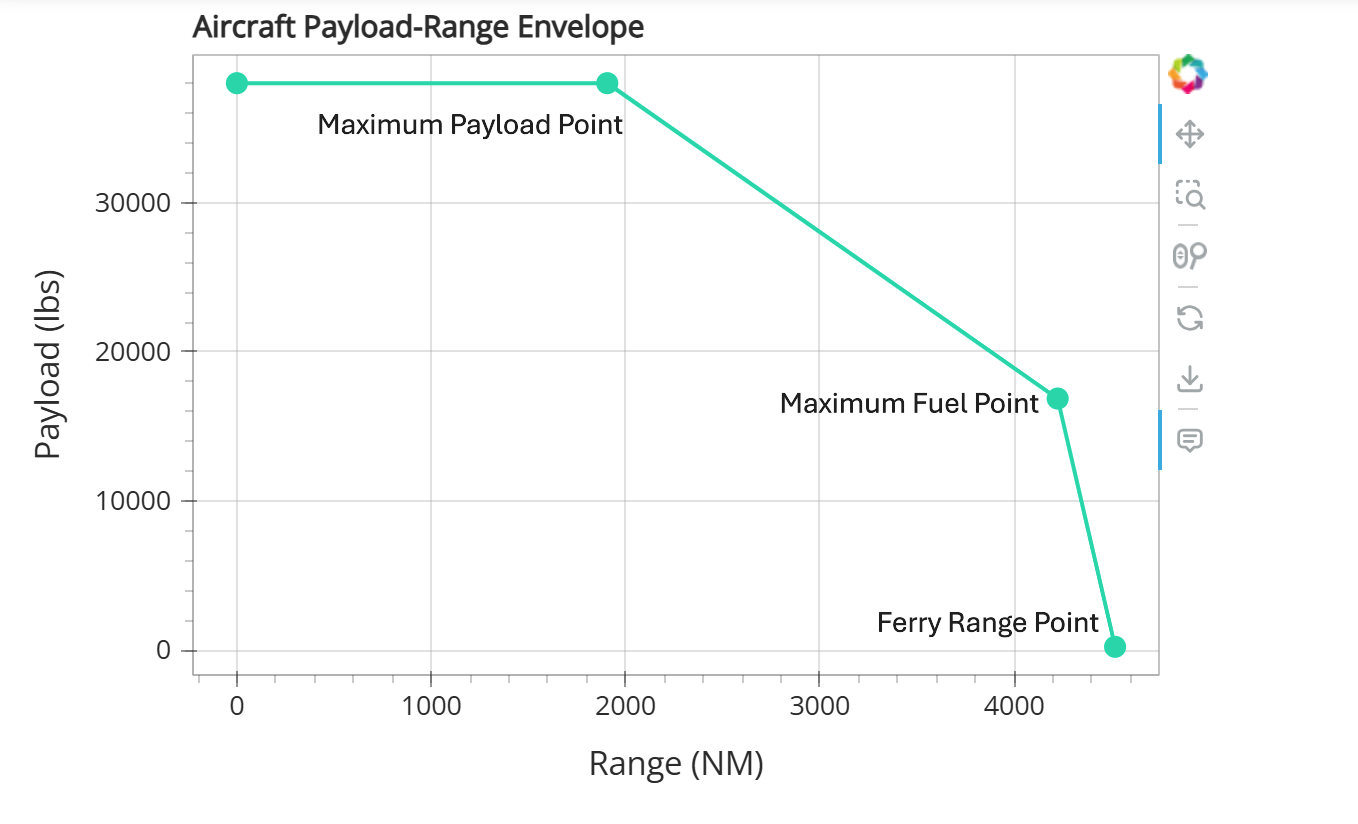
A payload-range diagram is an aircraft performance visualization that illustrates the trade-off between how much mass the aircraft can carry in terms of passengers and cargo (payload) vs how far it can fly (range). A payload-range diagram typically shows 3 salient points:
Maximum Payload + Fuel Point: The range the aircraft can fly with maximum payload mass and fuel mass up to the maximum gross mass. This is typically used as the design point of the aircraft (the “sizing” mission).
Maximum Fuel + Payload Point: The range the aircraft can fly with maximum fuel mass (equal to total_fuel_capacity) and payload mass up to maximum gross mass. This is the furthest range the aircraft can fly at its maximum gross mass.
Maximum Range Point: The range the aircraft can fly at maximum fuel capacity and zero payload. This is the furthest the aircraft can fly.
After a successful sizing mission (Maximum Payload + Fuel Point) the payload-range function calculates the required aircraft loading conditions and runs an OFF_DESIGN_MAX_RANGE mission for the “Maximum Fuel + Payload” and “Maximum Range” points.
When a user requests for a payload-range diagram to be generated, the additional points are run using the design mission’s phase info. It is assumed that this phase_info contains a cruise phase named cruise, and Aviary will automatically adjust the time_duration_bound of the cruise phase to account for the longer off-design missions.
Note
We highly recommend that users first read through Off Design Missions to understand the underlying mechanics of how Aviary runs off-design missions.
Each point is configured using the following methods:
Maximum Payload + Fuel Point: The results of the sizing mission are used to plot this point.
Maximum Fuel + Payload Point: The aircraft’s mission fuel is assumed to match
aircraft:fuel:total_capacity. The available payload is computed asaircraft:design:gross_massminusmission:operating_massminusaircraft:fuel:total_capacity. Therefore the aircraft’s mission mass is equal to itsaircraft:design:gross_mass.Maximum Range Point: The aircraft is flown at a gross mass equal to
mission:operating_massplusaircraft:fuel:total_capacity.
Note
Not all aircraft designs will have 3 distinct points. If an aircraft’s fuel capacity is very large, it could exceed its design gross mass when fully fueled to that capacity. In this case, the “Maximum Fuel + Payload” point would coincide with the “Maximum Range” Point. Aviary will not run that last point as it is redundant, and instead re-use the results of the maximum fuel point for building the payload-range data table.
Outputs#
After running all of the points of the payload-range diagram, a table of gross mass vs. range for each point is saved in a filed called payload_range_data.csv. This file is placed in the reports folder for that run.
Running a payload/range analysis#
There are currently two methods to run a payload-range analysis.
The first method is to set settings:payload_range to True in your csv input file or AviaryValues input (if using the Level 2 interface).
Note
Setting this flag will result in Aviary running a payload-range analysis every time that specific aircraft model is sized.
Method Call#
The second way to generate the payload-range diagram is to manually call the run_payload_range() method after running a sizing mission. If the payload range points run successfully, then the method returns a tuple containing the AviaryProblems used to create the ‘maximum fuel + payload range’ and ‘ferry range’ points.
(max_fuel_pyld_range_prob, ferry_range_prob) = prob.run_payload_range()
Output and visualization.#
The data for the payload-range points can be found in payload_range_data.csv, located within the main problem’s reports folder.
The information is also visualized within the Payload/Range Diagram tab in the Aviary dashboard for the sizing mission.
Note
Aviary will only save the results payload/range analysis (and therefore only plot the diagram in the dashboard) if the sizing and two off-design points converged to a valid solution.