
Atmsophere Subsystem#
Aviary has several built-in atmosphere models that support the Aerodynamics calculations, by providing temperature, pressure, speed of sound, and viscosity based on an input altitude. Aviary also includes atmosphere models for other planets including Mars and Venus. It is important to note that these models represent approximations. Real conditions may vary significantly which is why testing your model against several different atmospheric profiles is recommended.
Options#
There are some critical options you can pass to atmosphere that you should know about. These options will allow you to change which source data you use, add a temperature offset, and swap between geopotential or geometric altitude inputs (only for Earth-based atmospheres).
Changing the source data swaps the akima splines used to calculate temperature, pressure, and density as a function of altitude. You can swap between a number of different Earth and Mars atmosphere models.
Adding a temperature offset can enable simulation with especially hot or cold days which is useful in acoustic certification of aircraft. When inputting a temperature offset as an option, the temperature throughout the entire altitude regime is shifted up or down by this ammount. The pressure is assumed to remain constant. This is a simplification we must adhere to because we do not have any additional pressure data or assumptions to build upon. Density is then recalculated as an offset from the source data. This is important because that source data may differ from the ideal gas equations used to calculate density. This is the case for the MIL-SPEC-210A data.
All the options and their defaults and functions are shown below.
om.show_options_table('aviary.subsystems.atmosphere.atmosphere.AtmosphereComp')
| Option | Default | Acceptable Values | Acceptable Types | Description |
|---|---|---|---|---|
| always_opt | False | [True, False] | ['bool'] | If True, force nonlinear operations on this component to be included in the optimization loop even if this component is not relevant to the design variables and responses. |
| default_shape | (1,) | N/A | ['tuple'] | Default shape for variables that do not set val to a non-scalar value or set shape, shape_by_conn, copy_shape, or compute_shape. Default is (1,). |
| delta_T_Celcius | 0.0 | N/A | ['float', 'int'] | Temperature delta from International Standard Atmosphere (ISA) standard day conditions (degrees Celcius) |
| derivs_method | N/A | ['jax', 'cs', 'fd', None] | N/A | The method to use for computing derivatives |
| distributed | False | [True, False] | ['bool'] | If True, set all variables in this component as distributed across multiple processes |
| h_def | geopotential | ['geopotential', 'geometric'] | N/A | The definition of altitude provided as input to the component. If "geometric",it will be converted to geopotential based on Equation 19 in the original standard. |
| num_nodes | **Required** | N/A | ['int'] | Number of nodes to be evaluated in the RHS |
| run_root_only | False | [True, False] | ['bool'] | If True, call compute, compute_partials, linearize, apply_linear, apply_nonlinear, solve_linear, solve_nonlinear, and compute_jacvec_product only on rank 0 and broadcast the results to the other ranks. |
| settings:atmosphere_model | AtmosphereModel.STANDARD | [<AtmosphereModel.STANDARD: 'standard'>, <AtmosphereModel.COLD: 'cold'>, <AtmosphereModel.HOT: 'hot'>, <AtmosphereModel.TROPICAL: 'tropical'>, <AtmosphereModel.POLAR: 'polar'>, <AtmosphereModel.MARS_REFERENCE: 'mars_reference'>, <AtmosphereModel.MARS_HELLAS_HOT: 'mars_hellas_hot'>, <AtmosphereModel.MARS_HELLAS_COLD: 'mars_hellas_cold'>, <AtmosphereModel.MARS_EQUATOR_HOT: 'mars_equator_hot'>, <AtmosphereModel.MARS_EQUATOR_COLD: 'mars_equator_cold'>, <AtmosphereModel.MARS_POLAR_HOT: 'mars_polar_hot'>, <AtmosphereModel.MARS_POLAR_COLD: 'mars_polar_cold'>, <AtmosphereModel.VENUS_REFERENCE: 'venus_reference'>] | N/A | The type of atmosphere model to use to determine atmospheric properties for the whole mission. |
| use_jit | True | [True, False] | ['bool'] | If True, attempt to use jit on compute_primal, assuming jax or some other AD package capable of jitting is active. |
Earth Atmosphere#
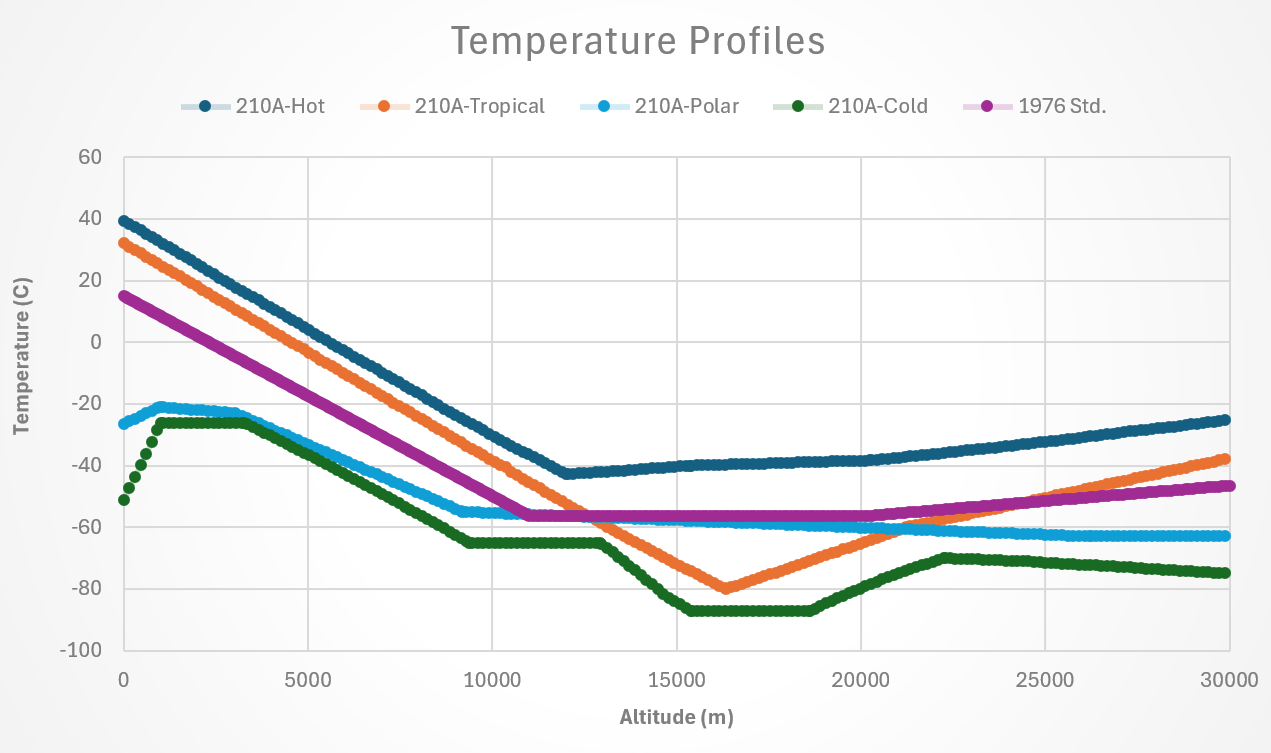
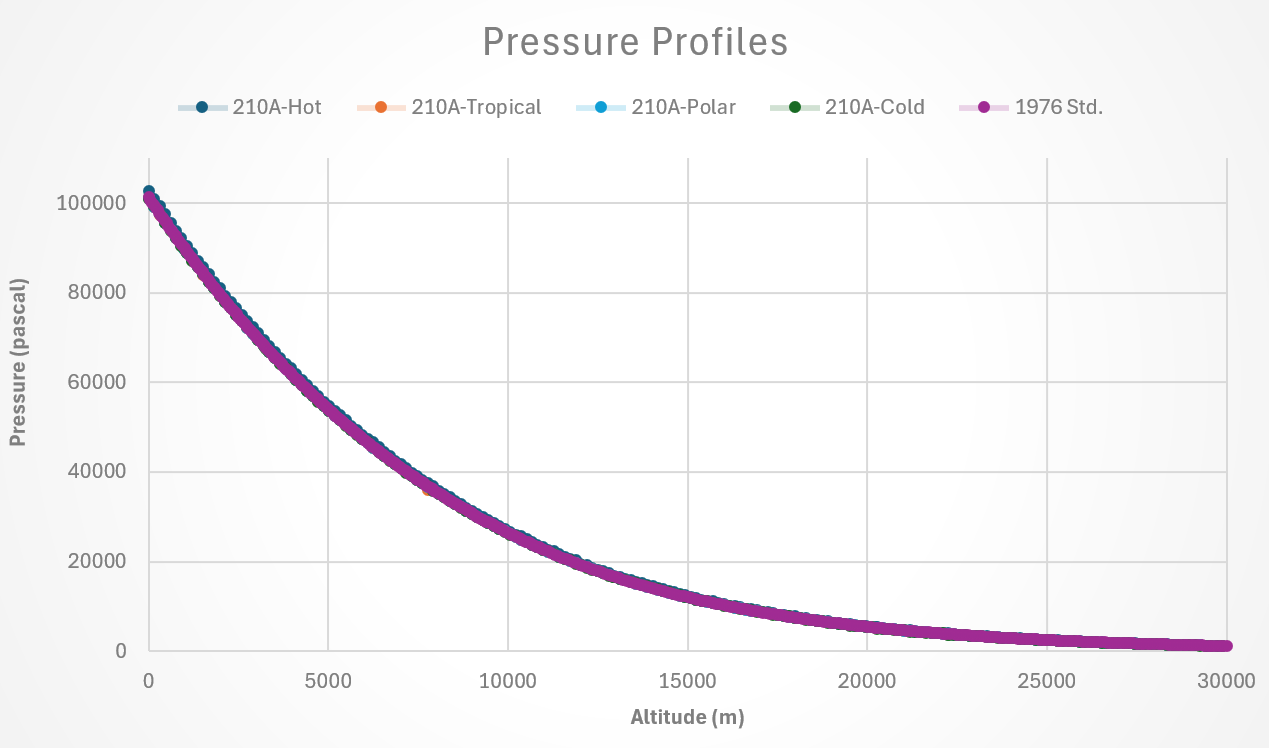
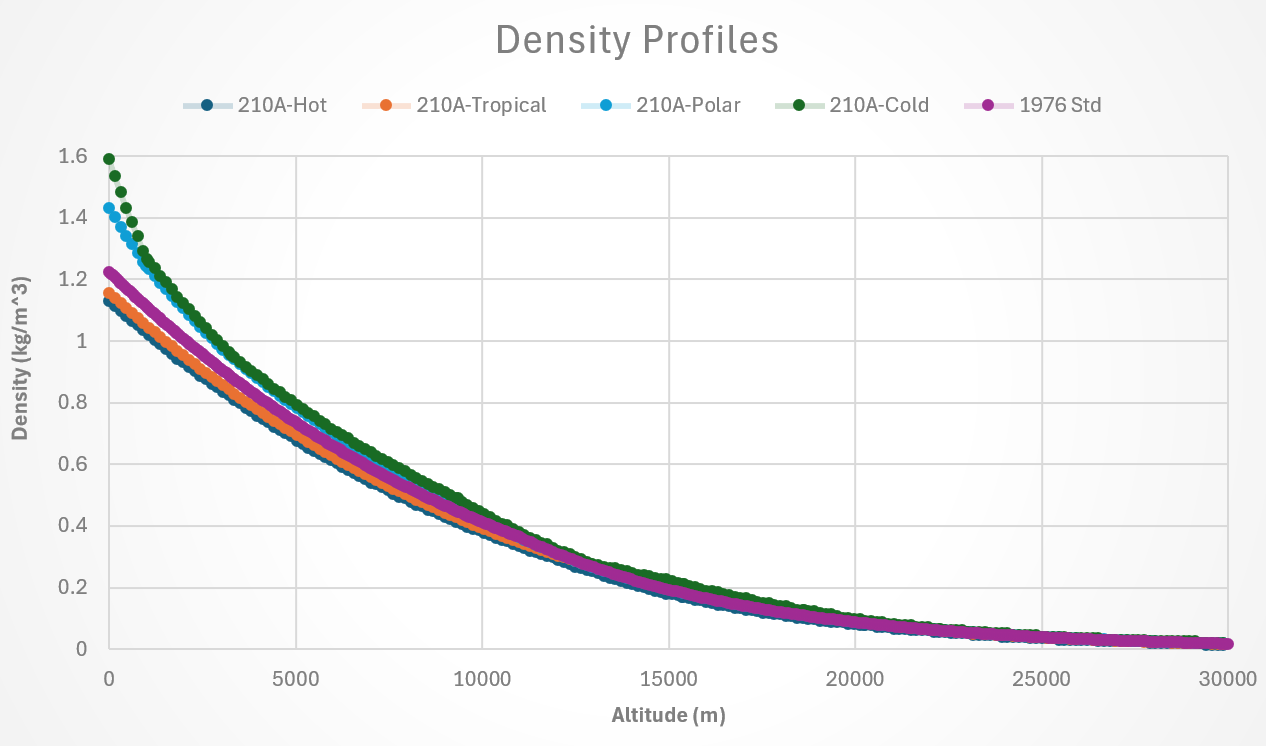
There are two different Earth atmosphere models implemented in Aviary, one coming from the 1976 standard atmosphere tables and the other coming from the publically released MIL-SPEC-210A tables. The standard 1976 tables are the default option and represent the typical conditions experienced at a given altitude. The MIL-SPEC-210A tables represent extreme atmospheres in tropical, arctic (polar winter), extreme hot, and extreme cold climates.
To select the atmosphere type, you can use options.set_val(Settings.ATMOSPHERE_MODEL, val=AtmosphereModel.STANDARD)
Comparison between Different Models#
A few graphs comparing the different models have been included so the user can visually understand the different atmosphere models.
How the Atmosphere Model Works#
Examining atmosphereComp.py will show the code on how the atmosphere component is implemented. Generally speaking, akima splines that represent the raw data are loaded into the model during initialization. The akima splines are used to enhances computational speed. During every subsequent call to the atmosphere mode, an input altitude is translated via the akima splines into a temperature, pressure, density and then additional calculations are performed to determine speed of sound, and dynamic viscosity. The raw data and the akima splines of that data are contained in individual files (StandardAtm1976.py, MIL_SPEC_210A_cold.py, MIL_SPEC_210A_hot.py, MIL_SPEC_210A_polar.py, MIL_SPEC_210A_tropical.py).
US 1976 Atmosphere Notes#
The US 1976 atmospheres source information and notes are as follows:
    United States standard atmosphere 1976 tables, data
    Based on the original model documented in https://www.ngdc.noaa.gov/stp/space-weather/online-publications/miscellaneous/us-standard-atmosphere-1976/us-standard-atmosphere_st76-1562_noaa.pdf
    based on NASA-TM-X-74335.

    Notes:
    The data table contains data from -5,000 meters to 83,000 meters altitude
MIL-SPEC-210A Atmosphere Notes#
The MIL-SPEC-210A atmospheres (including hot/cold/tropical/polar) source information and notes are as follows:
This information applies to MIL_SPEC_201A_tropical, MIL_SPEC_201A_polar, MIL_SPEC_201A_cold,
and MIL_SPEC_201A_hot

Source:
Data for the models was obtained from ASC-TR-93-5002 / AD-A264 639,
Graphical Comparison of U.S. Standard Atmospheres and Military Standard Climatic Extremes
by Joseph C. Zuppardo, February 1993
Approved for public release with unlimited distribution
https://apps.dtic.mil/sti/tr/pdf/ADA264639.pdf

Notes:
1) The data table contains data from 0 feet to 100,000 ft =~ 30,000 meters altitude
2) The composition of the atmosphere is constant throughout the altitude range.
3) Polar data represents an Arctic Winter atmosphere rather than a true polar atmosphere
4) Altitude was given in the raw data as Geopotential Altitude
5) Some data points in the original tables appeared to be in error.
i.e. for hot atmosphere at 20,000 ft pressure increased so much as to be the same as pressure
at 11,500 ft. Presumed errors like these were smoothed out to prevent kinks in the akima
splines.
6) Using the ideal gas equations to recalculate Density will yield
different results than the table.
7) Hot/Cold vs. Tropical/Polar have different sea level pressures (29.9 vs. 29.92 respectively),
despite the description by the paper that Hot/Cold are at 29.9. This can be verified by
looking directly at the tabular data presented in the paper.
8) The inHG measurement shown in the tables is assumed to be taken at 60 degF = 15C,
(as opposed to 32F = 0C). Supporting documentation for this is based on NIST and the US1976
atmosphere standard which lists sea-level pressure of 101,325 Pa, based on the NIST conversion
factors to translate Pa to inHG at 60F, these match up. inHg has a dependence on temperature
which makes it a very temperamental unit and should be avoided in the future.
https://physics.nist.gov/cgi-bin/cuu/Value?stdatm
https://www.ngdc.noaa.gov/stp/space-weather/online-publications/miscellaneous/us-standard-atmosphere-1976/us-standard-atmosphere_st76-1562_noaa.pdf
9) "The cold and hot atmosphere tables cannot be used for determining
engine and aircraft performance, aerodynamic characteristics, skin, compartment
and equipment temperatures under transient climb conditions" - Mil_Std_210A
10) "The polar and tropical atmospheres provide criteria for consideration in problems
dependent upon a hydrodynamically consistent homogeneous polar or tropical atmosphere.
These problems include determination of engine and aircraft performance,
aerodynamic characteristics, skin, compartment and equipment temperatures
under transient climb conditions," - Mil_Std_210A
Mars Atmospheres#
The Mars atmospheric models were derived from Mars-GRAM 2024.
To use the atmospheric profiles effectively, it is recommended to first start with the Mars_Reference data set, and then branch out to test extremes using the hot and cold data sets, and then proceed directly to generating a mission-specific data set using Mars-GRAM. For preliminary design of Mars air vehicles without a location or time in mind, the atmospheric profiles provided by aviary should suffice. These profiles was extracted from Mars-GRAM 2024, GRAM Suite 2.1. Detailed mission planning for Mars air vehicles should consider expected time of day and year for the flight as well as surface location. That information can be fed into Mars-GRAM in order to generate a specific atmospheric models for the specific conditions of that mission.
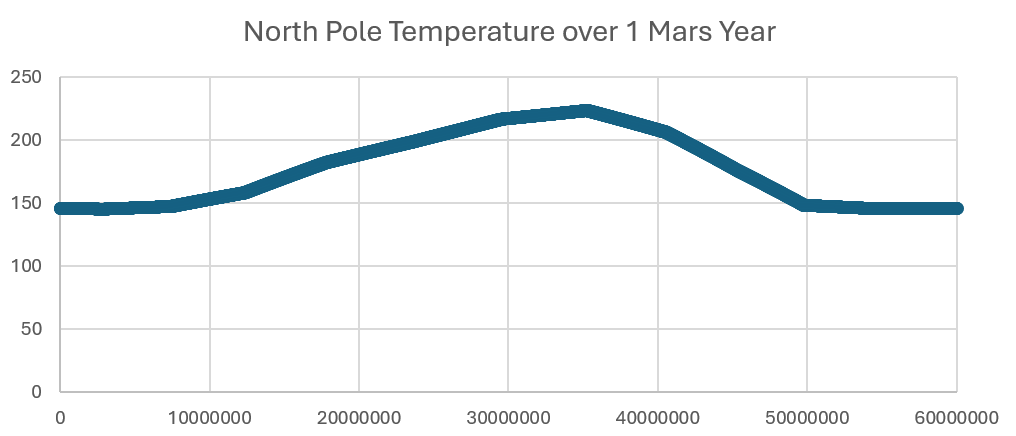
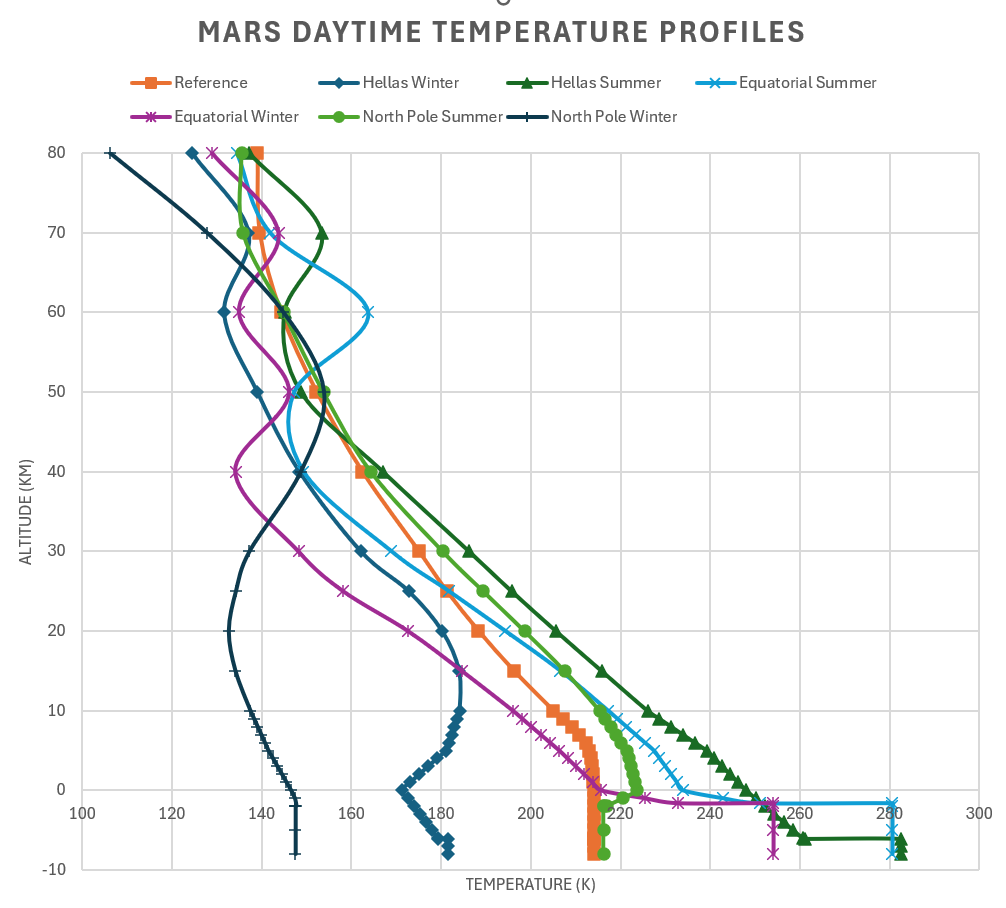
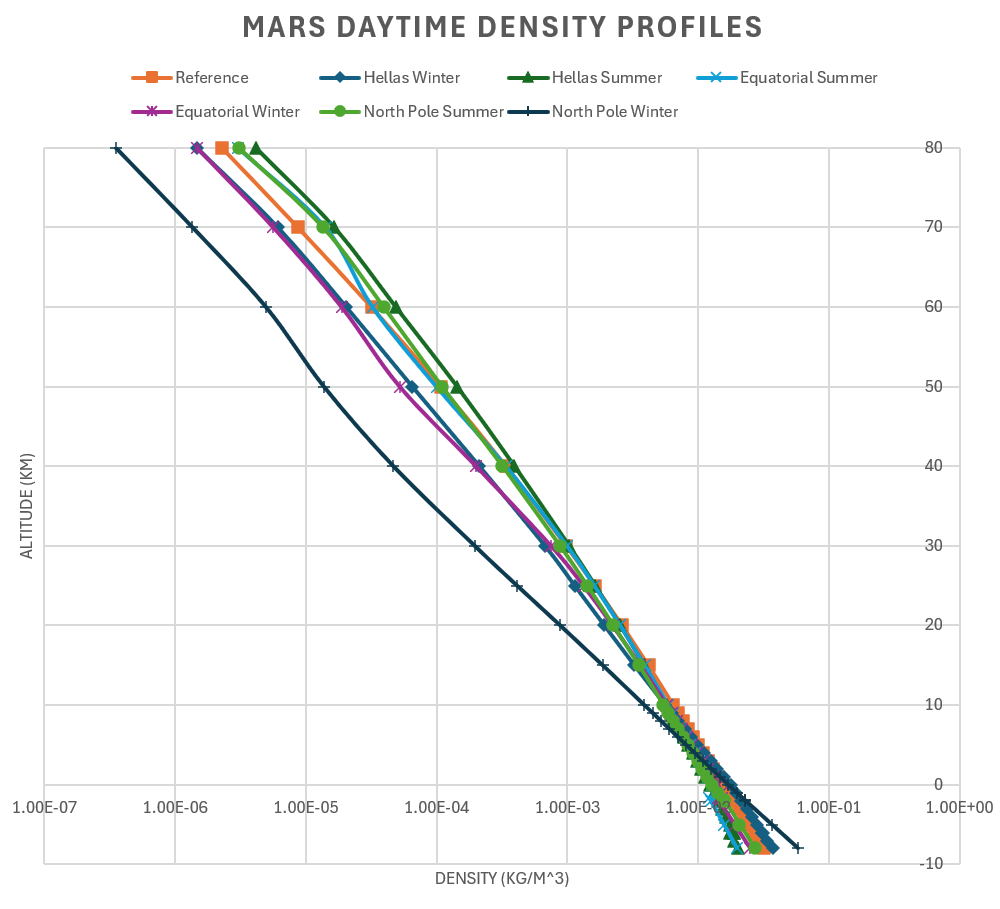
The Mars Reference data set represents a global average conditions, independent of year, season, or time of day. This data profile was verified by Melinda Kahre (NASA ARC) to be similar to global annual average conditions produced by Mars Global Climate Model (GCM) Simulations. Other areas that atmospheric tables were generated for include the Hellas Planitia because of it’s significant depth and high-density, equatorial conditions, and the North Pole.
The Cold data sets for Hellas, Equatorial, and Polar represent winter mid-day conditions at those respective locations. Mid-day was chosen because there needs to be light for the systems onboard the vehicle to determine their position relative to the terrain.
The Hot data sets for Hellas, Equatorial, and Polar represent summer mid-day conditions at those respective locations.
The speed of sound output from the atmosphere model is a calculation, and does not come from the published speed of sound from GRAM. This was done because the atmosphere modelling component is generic and must function for multiple atmosphere models, many of which do not supply speed of sound values.
Signifiant Differences to Earth Atmosphere Models#
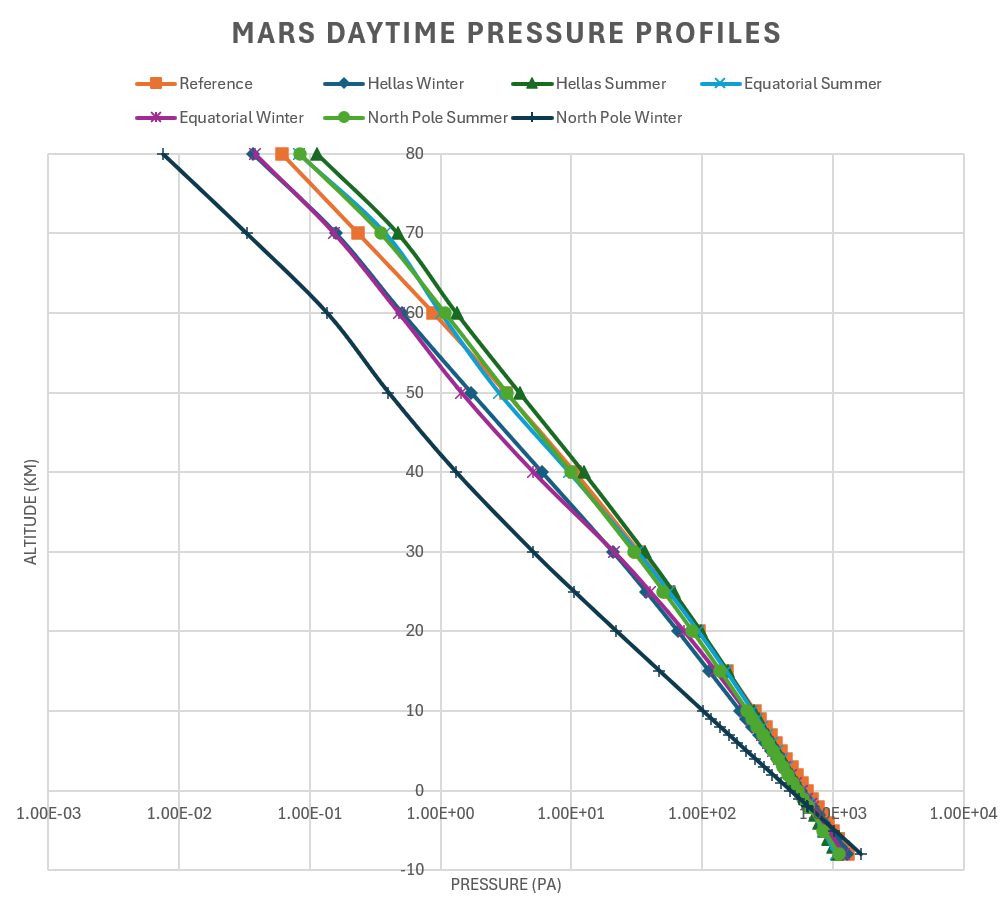
The Mars atmosphere has wide (100+ degC) fluctuations in temperatures and densities between day and night and seasonal variations between summer and winter due to very little thermal inertia from low density. Daily variations at the poles are very small.
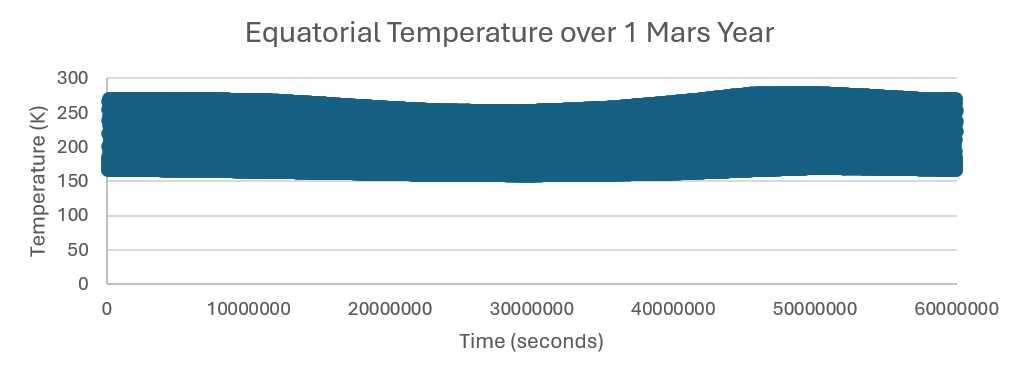
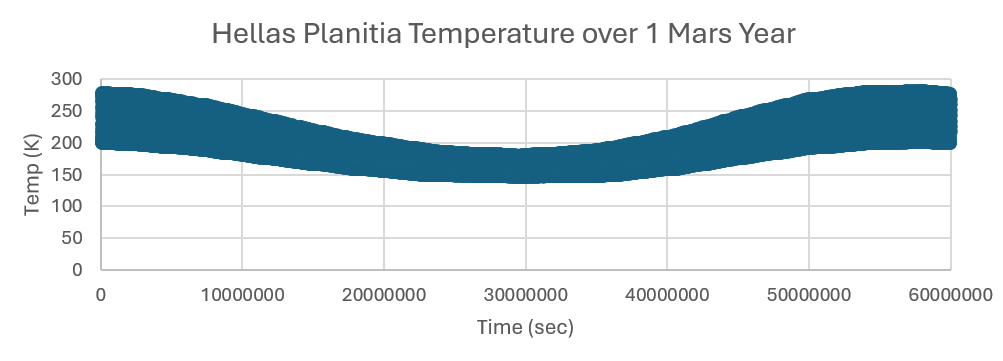
There is also variation due to dust level, which traps heata and thermal radiation from the ground. All of this data was collected assuming standard dust levels of 0.3. The first meter of atmosphere above the surface level may have significantly different temperature conditions than the rest of the atmosphere due to ground effect heating.
Zero altitude is defined as the point on the sufrance where the pressure is 6.1 milibar. Because Mars lacks water there is no “sea level”.
To select the atmosphere type, you can use options.set_val(Settings.ATMOSPHERE_MODEL, val=AtmosphereModel.MARS_REFERENCE)
Comparison between Different Models#
A few graphs comparing the different models have been included so the user can visually understand the different Mars atmosphere models.
Mars Reference Atmosphere Notes#
The Mars Reference atmospheres source information and notes are as follows:
from aviary.subsystems.atmosphere.data.MarsReference2024 import DATA_ORIGIN_NOTE

print(DATA_ORIGIN_NOTE)
    Data extracted from Mars-GRAM 2024, GRAM Suite 2.1 by Eliot Aretskin-Hariton (NASA GRC)
    Reference data set represents a global average conditions, independent of year, season, or time of day.
    Data profiles were verified by Melinda Kahre (NASA ARC) to be similar to global annual average conditions
    produced by Mars Global Climate Model Simulations.

    Notes:
    The data table contains data from -8000 meters to 80,000 meters altitude.
    The altitude is referenced to the MOLA (Mars Orbiter Laser Altimeter) constant potential surface (areoid).
    Dust level = 0.3
    Year = 2000
    F107 = 68.0
Venus Atmosphere#
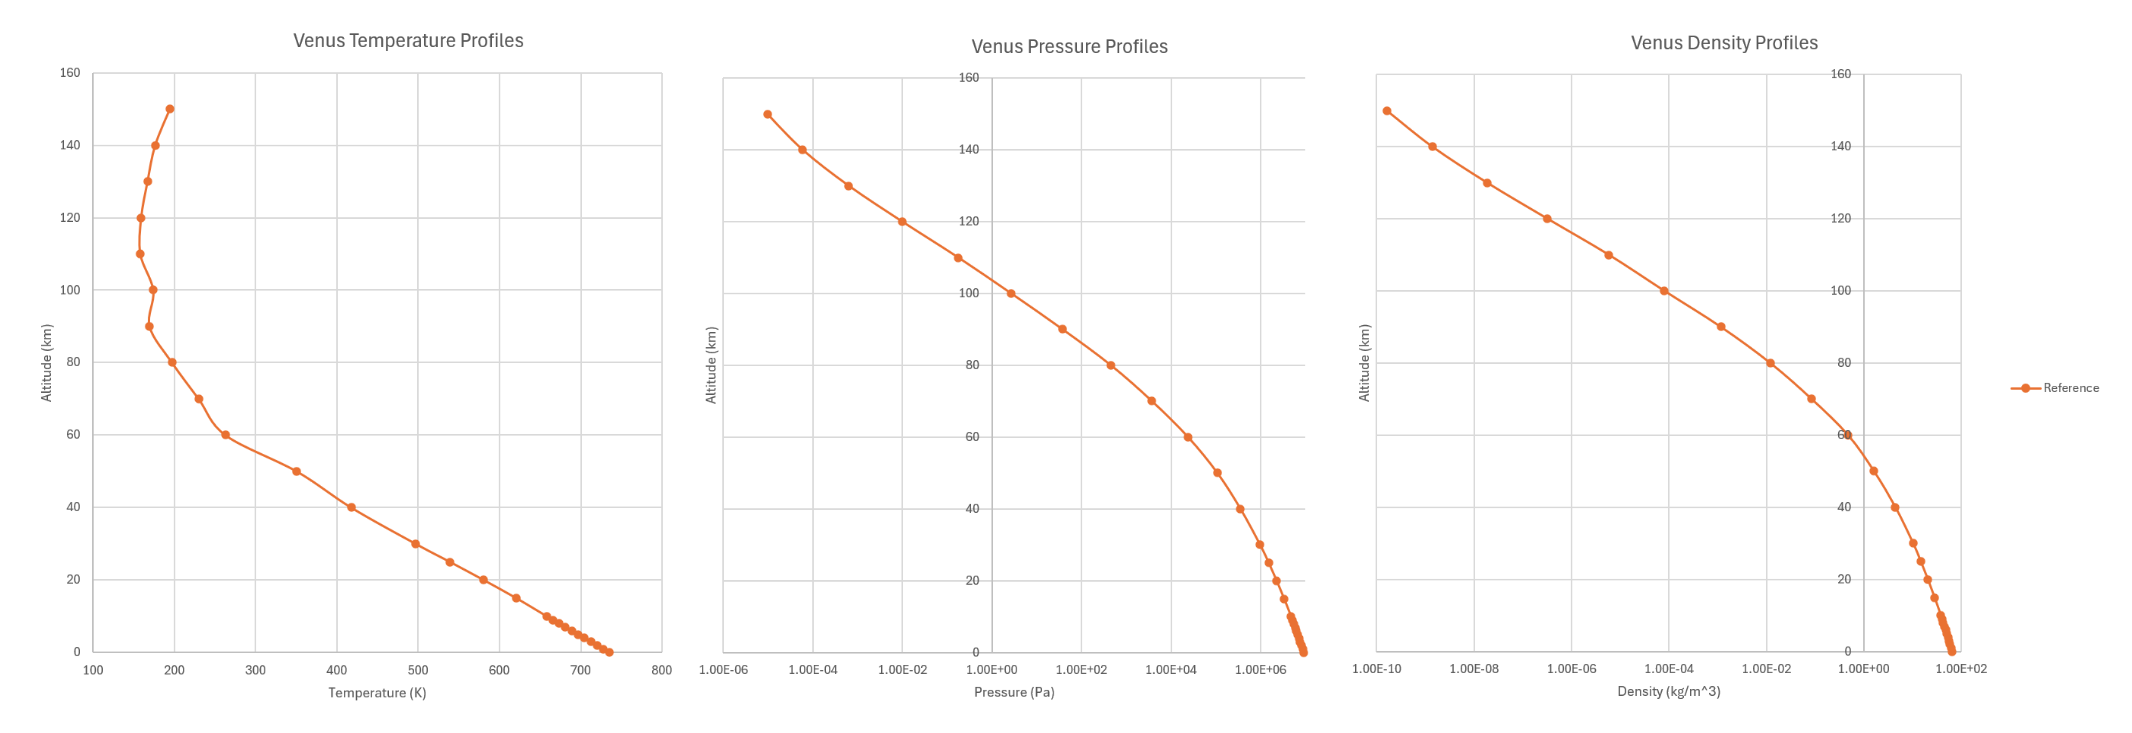
The Venus atmosphere profile was derived from Venus-GRAM 2021, which itself is an improvement over the VIRA (Venus International Reference Atmosphere) 2001 by Kliore et al. The Reference data set represents a global average conditions, independent of year, season, or time of day.
To use this model effectively it is recommended to start wit the reference atmosphere for preliminary design, and then build a new atmosphere model based on your specific mission conditions (i.e. latitude, height, and time of year) before transitioning to more detailed analysis.
There is some variation in venus atmosphere between the equator vs. the poles at altitudes above 30km, these differences are relatively small until altitudes of around 100km. After 100km altitude, the altitude profiles between the equatorial minimum and equatorial maximum have considerable temperature variation. This transition happens over a 58 earth-day cycle. The speed of sound output from the atmosphere model is a calculation, and does not come from the published speed of sound from GRAM. This was done because the atmosphere modelling component is generic and must function for multiple atmosphere models, many of which do not supply speed of sound values. The speed of sound calculations at higher altitudes 100km in particular have a high degree +/-25% of inaccuracy and should only be used as approximations.
Graphs of Venus Atmosphere#
Venus Reference Atmosphere Notes#
The Venus Reference atmospheres source information and notes are as follows:
from aviary.subsystems.atmosphere.data.VenusReference2021 import DATA_ORIGIN_NOTE

print(DATA_ORIGIN_NOTE)
    Data extracted from Venus-GRAM 2021, GRAM Suite 2.1 by Eliot Aretskin-Hariton (NASA GRC)
    Reference data set represents a global average conditions, independent of year, season, or time of day.
    Density variations for Venus are small below about 125 km. Variations of Venus density with Solar
    Zenith Angle (SZA) (as SZA changes with time-of-day and latitude) are significant above about 150 km.
    Variations of Venus density with solar activity (solar cycle) are not large.
    Venus-GRAM is based on the Venus International Reference Atmosphere (VIRA) model published in 1985
    and also contains numerous updates since then. For details see the
    Venus Global Reference Atmospheric Model (Venus-GRAM): User Guide, NASA/TM-20210022168 by H. L. Justh et al.

    Notes:
    The data table contains data from 0 meters to 150,000 meters altitude.
    The original altitude input and output to Venus-GRAM is measured based the reference ellipsoid (a geometric height).
    This data was re-interpolated to be based on the equipotential surface to match Earth and Mars inputs.
    Original source altitudes are included as atm_data._raw_data_geometric .
Adding your own Atmosphere Model#
If you desire to add your own atmosphere model you can do this one of two ways. Either create a new AtmosphereComp.py from scratch, or by importing a new set of raw data and using the current atmosphereComp.py to read it in and process it. This will include first saving your new raw data set in a new file and then creating a new set of akima splines for that data and also saving them in the same file. After that, utils/build_akima_coefs.py can read in the akima’s and run as normal. This walkthrough will help you perform the latter option. Start by creating a new file to hold your raw atmosphere model and the eventual akima splines.
Create a new Atmosphere file#
You will need to make a new file to hold the raw data of your atmosphere model and the akima splines. This file should be titled after your atmosphere model, i.e. StandardAtm1976 or MIL_SPEC_210A_Cold.
Save that file inside of the aviary/subsystems/atmosphere/data folder.
You will need to make a new _raw_data dictionary inside your new file. Look at the example _raw_data contained in data/StandardAtm1976 for reference.
Converting Raw data Proper Units#
From here on our we need to be especially mindful of units. We are going to use a utility function build_akima_coefs to help create the akima coefficients. The helper function is located in utils/build_akima_coefs.py.
We only need to build the akima coefficients once and we do it so that the atmosphere model is very fast. The atmosphere model will need the following information: (Altitude, Temperature, Pressure, Density). If you don’t have one of those values that’s ok, typically given Altitude, Temperature, and some assumption of the pressure at sea level, all other values can be calculated based on ideal gas assumptions.
Your units inside of _raw_data should be one of the following:
English: [altitude (ft, ), temperature (degF), pressure (inHg at 60degF), density (lbm/ft**3)]
Altitude can be in either in geometric or geopotential
Pressure will only translate properly if given in inHg at 60degF. However, many data sets use inHg at 30degF.
SI Units: [altitude (m), temperature (degK), pressure (millibar), density (kg/m^3)] Altitude can be in either in geometric or geopotential
If your units do not match either English or SI as designated above, you will need to modify the build_akima_coefs function to properly translate your raw data into SI units. (All calculations inside of atmosphere.py are happening in SI units with SI akima splines)
Processing new Akima Splines#
Next, open up utils/build_akima_coefs.py, you will notice that at the bottom of the file there is an call to if __name__ == '__main__':. Change the import location to point to your new _raw_data file and change the units to be either SI or English, depending on your raw data. Then execute python atmosphereComp.py, this will call the build_akima_coefs to build the akima splines using your raw data. Copy those splines into your new atmosphere file you made a few steps earlier and save the file.
Add the new data to Enums#
You also need to add your new atmosphere model to the Enums so that it shows up automatically for ease of use:
Head over to aviary.variable_info.enums.py and modify the class AtmosphereModel(Enum): to add your new atmosphere model name.
Import the Processed Data#
Next we will need to import these akima splines into AtmosphereComp() i.e.
from aviary.subsystems.atmosphere.data.NEW_DATA_FILE import atm_data as new_data
Lastly in Setup() section of AtmosphereComp() there is a section of code that loads the atmosphere model based on the user specified option. Add a new line there to properly load youre new file:
elif self.options[Settings.ATMOSPHERE_MODEL] is AtmosphereModel.'new_name': self.source_data = new_data
Test Your Model#
Now that you have your model loaded and ready to go, use the manual test at the bottom of utils/build_akima_coefs.py to test inputting a few altitude values into your model and inspect the resulting output of temperature, pressure, density, speed of sound, and dynamic viscosity.