
Drawing and running simple missions#
Overview#
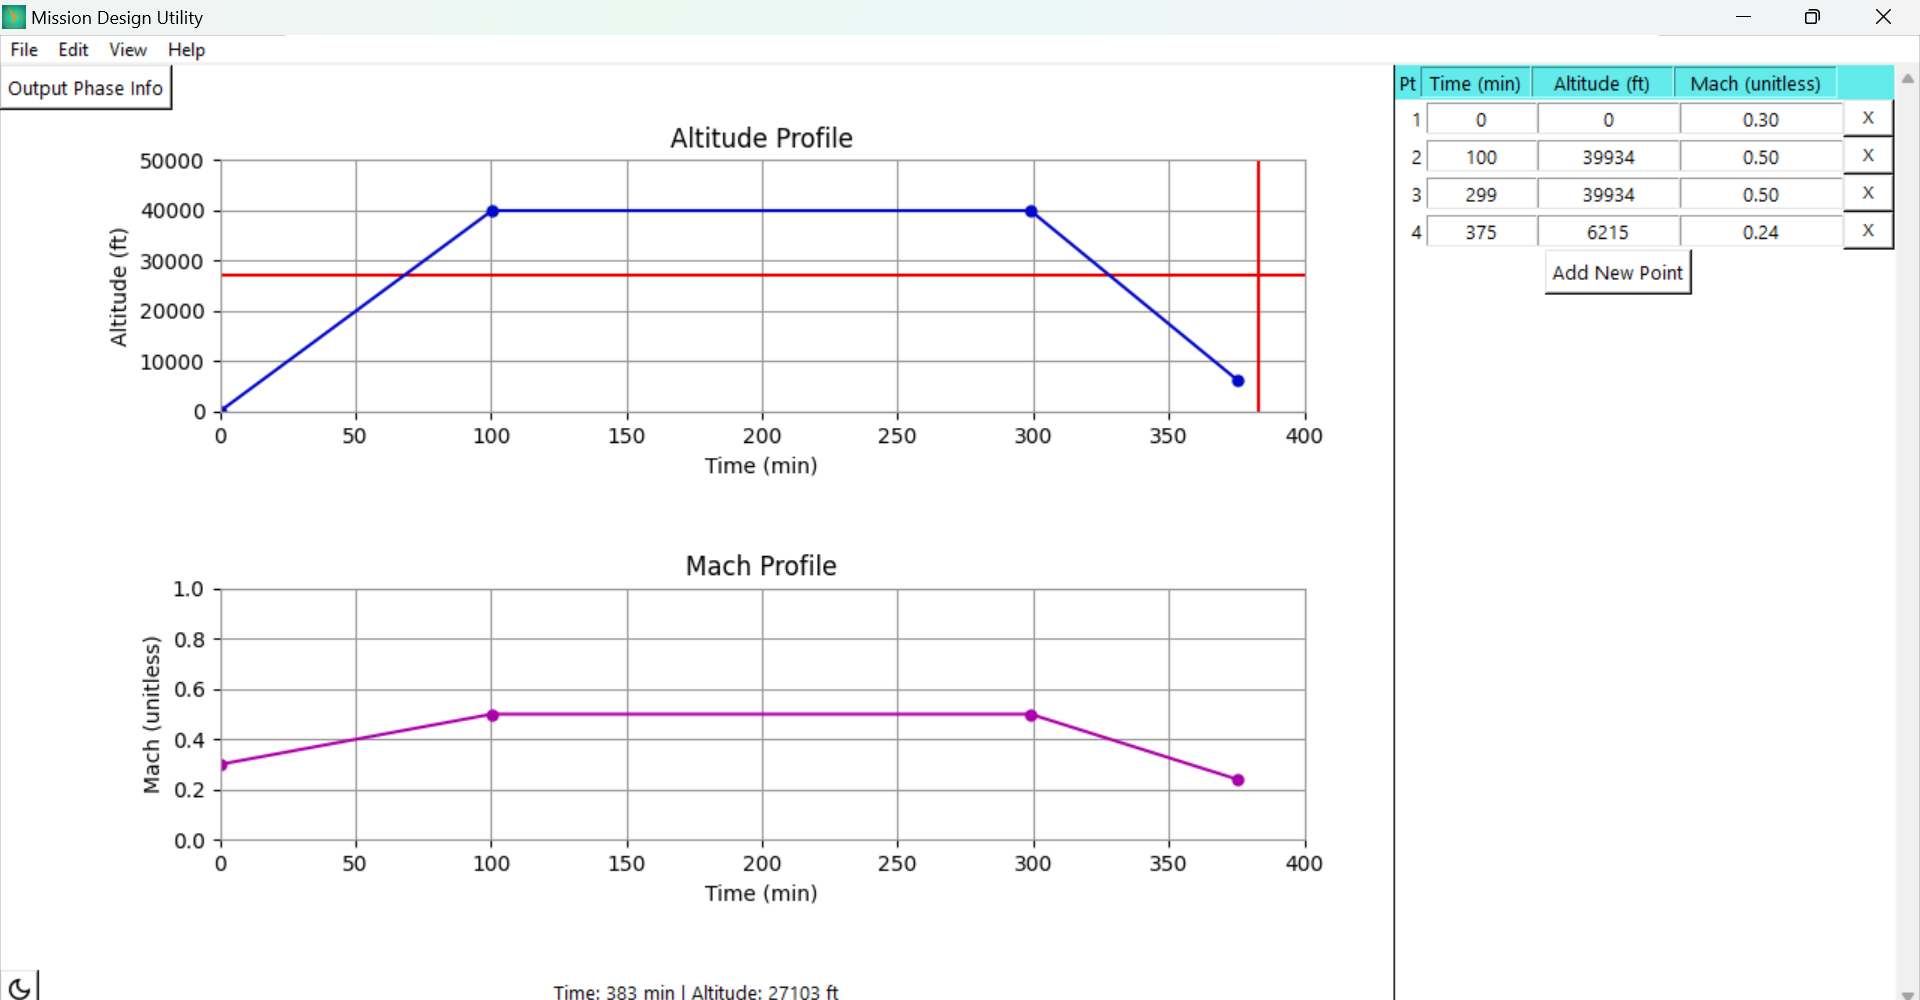
Aviary comes with a simple built-in graphical interface for defining missions. This tool can be accessed via the command line and provides an interactive way to define flight phases, including altitude, Mach number, and optimization parameters.
It is specifically made to only be used with the equationsofmotion.energy_state mission method.
You could use the results from the GUI to run a mission with a different method, but it would require manually changing the generated phase_info python dictionary.
Getting Started#
To launch the Flight Profile Utility, use the following command in your terminal:
aviary draw_mission
This command will open a graphical interface where you can interactively design a flight profile.
Note
If you are WSL on Windows you might need to install an X Server to run the GUI without issues. If you do this, also modify your .bashrc file to include this line: export DISPLAY=localhost:0.0.
Graphical Interface Usage#
Main Components#
Altitude Profile: Graphically represents the altitude profile over time. Users can add new points by clicking on the plot and edit existing points by dragging. Units and axes limits can be changed through the menu.
Mach Profile: Similar to the Altitude Plot but for the Mach number profile.
Table Entry: Tabular form of defining a mission. You can add new points through the
Add New Pointbutton, edit existing points by changing the values in the table entries, and delete points by pressing theXbutton next to any point. The plots and tables update with changes to either one.
Interactive Features#
Adding Points: Click on either the Altitude or Mach plot area to add a new point. Points on the Altitude plot represent altitude (in feet by default) at a specific time (in minutes by default), whereas points on the Mach plot represent the Mach number at specific times.
Dragging Points: Points on both plots can be dragged to adjust values. This allows for fine-tuning of the flight profile.
Removing Points: Press the
Xbutton next to the point on the tabular section to remove that point.Output Phase Info: Press this button to create an output python file named
outputted_phase_info.pywhich contains the mission information in a python dictionary calledphase_info. This button serves the same function as using the menuFile->SaveLight/Dark Mode: Press the button on the bottom left to toggle the theme between light and dark mode. The default is light mode. If the user chooses to save settings (read
Edit Tabbelow), the last used theme will be loaded the next time the program is run.
Output#
Upon completion, the tool outputs a Python script named outputted_phase_info.py in the current working directory. Alternatively, if the user uses the Save As command, a python script with the user specified name will be saved in the user specified directory. This tool overwrites any existing python file with the same name as the output. This outputted file contains the phase_info dictionary, which holds the flight profile data structured for use in mission simulations.
Note
When using the outputted phase_info dict in a mission simulation, you can modify the settings by directly changing the outputted Python file.
The phase_info dictionary makes some assumptions about different settings which you can also modify.
For example, the time duration of each phase is controlled by the optimizer if fix_duration is False, though this can be changed to True to fix the duration of each phase.
If you don’t have the black python autoformatter installed, your output may look slightly different - as long as you see confirmation that your phase info has been saved, your mission profile was successfully created.
Running a Mission Simulation#
After generating the flight profile, use the run_mission command to simulate the mission.
This command utilizes the phase_info from outputted_phase_info.py and simulates the mission based on the defined parameters. In the commands below, replace outputted_phase_info.py with your filename if you choose to save the output file with a different filename.
You can use the --phase_info flag to specify the path to the outputted_phase_info.py file.
Here we use a benchmark case as the inputted .csv file, though you can use any Aviary .csv here that defines an aircraft.
aviary run_mission --phase_info outputted_phase_info.py validation_cases/benchmark_tests/test_aircraft/aircraft_for_bench_FwFm.csv
You can also supply an optimizer, otherwise the default (SLSQP) will be used. Here is how you’d run the mission with the IPOPT optimizer:
aviary run_mission --optimizer IPOPT --phase_info outputted_phase_info.py validation_cases/benchmark_tests/test_aircraft/aircraft_for_bench_FwFm.csv
Note
When you run Aviary all of the outputs will be saved in the location where you run the command or run script. Outputs files such as optimization history and Dymos output files are saved at that location. A folder named ‘report’ will also be created there, and contains all of the associated report files for your runs. These reports include optimization and trajectory reports generated by OpenMDAO and Dymos.