
Postprocessing and Visualizing Results from Aviary#
Dashboard#
Aviary provides the ability to create a dashboard that lets the user easily browse between the reports and files that are generated during an Aviary run. The dashboard runs locally inside a Web-browser.
The dashboard is organized into 4 sections: Model, Optimization, Results, and Subsystems.
The dashboard assumes these locations for the various reports that are embedded into the dashboard.
Section |
File |
Location |
|---|---|---|
Model |
Input Checks |
./name_of_run_script_out/reports/input_checks.md |
Model |
Inputs |
./name_of_run_script_out/reports/inputs.html |
Model |
Debug Input List |
./name_of_run_script_out/reports/input_list.txt |
Model |
Debug Input List |
./name_of_run_script_out/reports/output_list.txt |
Model |
N2 |
./name_of_run_script_out/reports/n2.html |
Model |
Trajectory Linkage Report |
./name_of_run_script_out/reports/traj_linkage_report.html |
Optimization |
Driver Scaling Report |
./name_of_run_script_out/reports/driver_scaling_report.html |
Optimization |
Total Coloring Report |
./name_of_run_script_out/reports/total_coloring.html |
Optimization |
Optimization Report |
./name_of_run_script_out/reports/opt_report.html |
Optimization |
SNOPT Output (similarly for other optimizers) |
./name_of_run_script_out/reports/SNOPT_print.out |
Results |
Trajectory Results Report |
./name_of_run_script/reports/traj_results_report.html |
Results |
Subsystem Results |
./name_of_run_script_out/reports/subsystems/name_of_subsystem.md (or .html) |
Results |
Mission Results |
./name_of_run_script_out/reports/subsystems/mission_summary.md |
Results |
Problem final case recording |
./name_of_run_script_out/problem_history.db |
As an example of the workflow for the dashboard, assume that the user has run an Aviary script, run_level2_example.py, which records both the Problem final case and also all the cases of the optimization done by the Driver. The sample code can be found in aviary/examples folder. (To record both the Problem final case and also the Driver optimization iterations, the user must make use of the verbosity flag in the call to run_aviary_problem().)
python level2_example.py
After the run is completed, the user can run the dashboard using:
aviary dashboard level2_example
Note
If you run a Level 1 script, you can access the dashboard using the csv input filename instead of a script name:
aviary dashboard <input_filename>
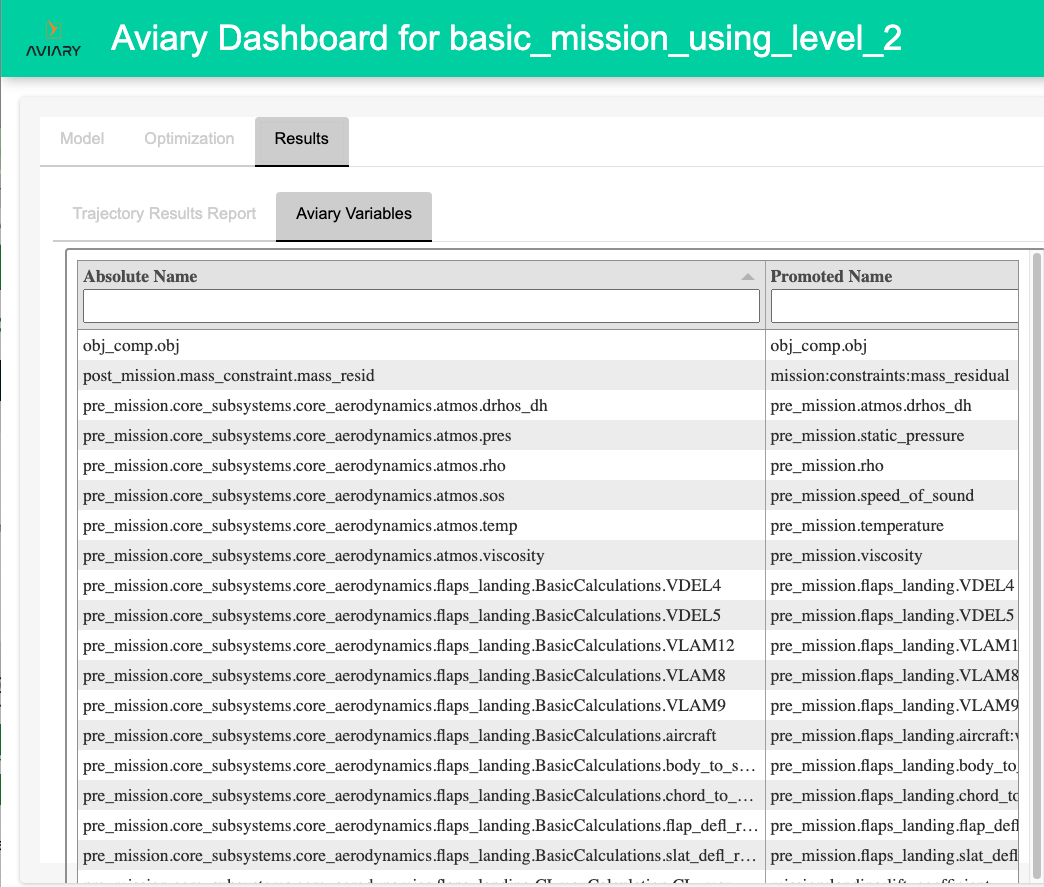
The resulting dashboard would look something like this:
Note
The Problem recorder file is required for the Aircraft 3d model tab to be displayed in the dashboard.
Saving and Sharing Dashboards#
The user can also save a dashboard and share it with other users to view. The dashboard is saved as a zip file. To save a dashboard to a file, use the --save option. For example,
aviary dashboard --save
By default, the zip file is named based on the name of the problem. So in this example, the saved zip file will be named run_level2_example.zip.
If the user wants to save to a different file, they can provide that file name as an argument to the --save option as in this example:
aviary dashboard --save saved_dashboard.zip level2_example
In this case, the zip file will be named saved_dashboard.zip.
This user can then share the zipped file with another user. That user can view the dashboard using:
aviary dashboard saved_dashboard.zip
Running this form of the dashboard command will result in a new directory being created in the reports directory. For the example, this
directory is named reports/saved_dashboard. If that directory existed previously, the command will fail to prevent the existing directory from being overwritten. The user can force that overwriting to happen by using the --force option, as shown in this example:
aviary dashboard --force saved_dashboard.zip
The user can also save the dashboard from within the dashboard itself. There is a button at the top of the page to save the dashboard. The saved zip file will be named based on the problem name.
Accessing Variables#
How to get print/access any variable as an output.
Reports and Outputs#
Default Reports#
Each standard Aviary run generates several output files. Which output files are generated depend on the run options. There is always a sub-folder reports/<name of run script> that contains a few HTML files.
driver_scaling_report.htmlThis is an OpenMDAO output. After all design variables, objectives, and constraints are declared and the problem has been set up, this report presents all the design variables and constraints in all phases as well as the objectives.
It lists design variables and constraints and objectives in three different tables. It contains the following columns: name, size, indices, driver value and units, model value and units, ref, ref0, scaler, adder, etc. It contains a Jacobian Info matrix too.
More details can be found at openmdao scaling.
input_checks.mdThis report gives a list of all unconnected inputs in the model that have not been specificed in the prob.aviary_inputs, which includes inputs in the csv file along with any that were added to it prior to setup.
It is split into two section: the first contains variables in the aircraft:* and mission:* hierarchy, while the second contains all of the other variables.
The purpose of this report is to help identify variables that may have been accidentally omitted in the aircraft definition.
inputs.htmlThis is a sortable and filterable inputs report of input variables in different phases.
It contains the following columns: absolute name, source name, source is IVC, source is DV, units, shape, tags, val, min val, and max val. Here,
IVCis the abbreviation ofIndepVarCompandDVis the abbreviation of “design variable”.
overridden_variables.mdThis report shows any variables that have been overridden either internally or externally”. See Overriding Variables for information about overridden variables in Aviary.
n2.htmlThis is an OpenMDAO model hierarchy and an N-squared diagram in the shape of a matrix, representing functional or physical interfaces between system elements. It can be used to systematically identify, define, tabulate, design, and analyze functional and physical interfaces.
More information can be found at OpenMDAO’s N2 Basics and N2 Details. There is a tutorial on YouTube.
opt_report.htmlThis is the OpenMDAO Optimization Report. It writes a summary of results of an optimization run.
OpenMDAO reference is at Optimization Report.
total_coloring.htmlOpenMDAO computes a coloring for the total jacobian.
More information can be found at Simultaneous Total Derivative Coloring For Separable Problems and Simultaneous Coloring of Approximated Derivatives.
traj_linkage_report.htmlThis is a dymos linkage report. It provides a report detailing how phases are linked together via constraint or connection. It can be used to identify errant linkages between fixed quantities.
traj_results_report.htmlThis file contains timeseries and phase parameters in different tabs.
We will show details of the above reports in the onboarding docs.
OpenMDAO has a reports system which will generate reports when you run your model. More on OpenMDAO reports system can be found here.
Database Output Files#
Aviary creates an SQLite database output called problem_history.db. It can be used to rerun your case, though we do not detail that here. Users can write a separate Python script to create user customized outputs and graphs. We will show how to use the this database to create a customized graph in the onboarding docs.
Report Location#
Reports are placed a subdirectory called reports under the directory where the script was run. The subdirectory’s name for Level 1 runs is based on the name of the CSV file used to define aircraft and mission properties. For Level 2 and Level 3 runs, the name is based on the name of the Python script being run.
Warning About the Reports Directory#
Repeated runs of the same script (Levels 2 and 3) or the same aircraft definition CSV file (Level 1) will overwrite existing reports directories. So to preserve reports from previous runs, the user should make copies of the report directory before starting another run.
Relevant Reports#
There is an optimizer output. If SNOPT is the optimizer, SNOPT_print.out is generated. The SNOPT output is a detailed output of the optimizer performance. New users likely will want to exercise caution when viewing this output, as it includes some advanced information.
If IPOPT is the optimizer, IPOPT.out is generated. If SLSQP is the optimizer and pyOptSparseDriver is the driver, SLSQP.out is generated.
If Verbosity is set to VERBOSE or DEBUG, input_list.txt and output_list.txt are generated.
You may notice some warning messages in the Aviary output. Frequently seen warnings are:
PromotionWarning: Issued when there is ambiguity due to variable promotion (an OpenMDAO warning).
RuntimeWarning: Issued for warnings about dubious runtime features (a Python warning).
UserWarning: Issued for warnings about potential OpenMDAO, Dymos, and/or Aviary problems.
DerivativesWarning: Issued when the approximated partials or coloring cannot be evaluated as expected (an OpenMDAO warning).
Users should pay attention accordingly.
When a problem is setup, we can add an argument check=True. This is an OpenMDAO feature (see Setup Your Model for more information). If we do, a bunch of checks will be performed. You will see those checks on the command line.
After a model is run, a check_partials() method can be applied and results are printed to the command line. This helps us make sure all of our partial derivatives are correct. We refer users to OpenMDAO’s document Working with Derivatives
Using Finite Difference or Complex Step.
When Aviary is run, some messages are printed on the command line and they are important. More details are in the onboarding docs.
In addition, users can add their own outputs.
We will cover more details on all those outputs when we show concrete examples in the onboarding docs.
Timeseries Mission Output Report#
The outputs of the aircraft trajectory are outputted in a file called mission_timeseries_data.csv within the reports directory.
This file contains a comma-separated list of some outputs from the mission.
Any value that is included in the timeseries data is included in this file.
These files are useful for post-processing and inputting the mission outputs into other tools, especially those used for acoustic analysis.
Note
This feature is under further development. Please let us know if you have any suggestions for functionality or improvements.
Here is an example of the first few lines of a mission_timeseries_data.csv file:
time (s),mach (unitless),thrust_net_total (lbf),drag (lbf),specific_energy_rate_excess (m/s),fuel_flow_rate_negative_total (lbm/h),altitude_rate (ft/s),throttle (unitless),velocity (m/s),time_phase (s),mach_rate (unitless/s),altitude (ft),mass (kg),distance (m)
0.0,0.2,28478.788920867584,21108.418300418845,12.350271989430475,-10492.593707324704,8.333333333333337,0.565484286063171,68.05737270077049,0.0,0.0001354166666666668,0.0,79560.101698,1.0
160.16130859524844,0.22168851053893995,24443.964075954416,17707.343638310154,13.681656556939739,-9195.769418149232,8.333333333333341,0.5231597651569796,75.090771635822,160.16130859524844,0.0001354166666666669,1334.6775716270722,79362.06974727994,11458.09964519708
If you want to add additional outputs, call add_timeseries_output on the phases.
Please refer to the Dymos documentation on timeseries outputs for more information on how to do this.